Analysis of recent downtime & what we’re doing to prevent future incidents
Asana recently had downtime due to a single shared database, lasting at least 92 minutes on July 29, 51 minutes on August 1, and 34 minutes on August 13. While we’ve significantly reduced the length of downtime, these events don’t meet our quality standards, and we take this downtime very seriously. We’ve identified the root cause of these events, as well as triggering events including application bugs and hardware failures, and are working hard to ensure that our response and recovery for any potential future downtime events is as fast as possible.
We wanted to outline the changes we’ve made so far to prevent future incidents, as well as provide a more detailed technical explanation of what happened and how we intend to prevent this kind of problem in the future.
What we’re doing to prevent future incidents
As Asana continues to scale our operations, we’re conducting a number of infrastructure enhancements, including expanding our data centers to improve reliability. In the long term, these enhancements will allow us to deliver a faster and more reliable service.
In the short term, the changes we’ve made include:
- Bug fixes and changes to prevent a positive feedback loop at the application level
- Admissions control to avoid excess concurrency, for recovery from transient high load
- Load testing to failure to confirm our fixes
In the longer term, the strategies we’re pursuing are:
- Move data like this from shared AWS RDS instances to a data store which provides higher reliability/fewer single points of failure (but some change in data semantics, like DynamoDB)
- Improve tools for monitoring and investigation (both incremental improvements to improve reliability and completeness, and integration with a framework based on OpenTracing)
- Test to failure to find system limitations and bottlenecks
Incident analysis
Most of our users’ data is sharded into multiple servers for scalability and reliability, but some data is part of a shared or global data store. The database affected during all three of these events contains a part of our Data Model shared across all teams and workspaces of a user.
We use MySQL with a high-availability configuration provided by AWS for all of our databases, including shared ones. When there is a problem with the underlying hardware, we expect an interruption lasting a few minutes as we swap to the hot spare (or as this happens automatically). Our application retries and the disruption should be minimal. But with these three events, we saw poor performance, (high latency and high queues or queue overflows, in both MySQL and our application servers) after failover due to overload. This is a category of positive feedback, where increased latency causes additional work, which further increases latency (due to contention and the costs of managing the work in flight). Even if the initial trigger resolves, the system may not recover.
We have systems designed to prevent positive feedback/cascade failure due to overload, but didn’t have the same quite the same protections set up for this database. One of the reasons it was treated differently is that unavailability of it causes unavailability of some core features; triggering incorrectly would also have caused outages.
Dates and times are in UTC; graphs are normalized to 2 hours.
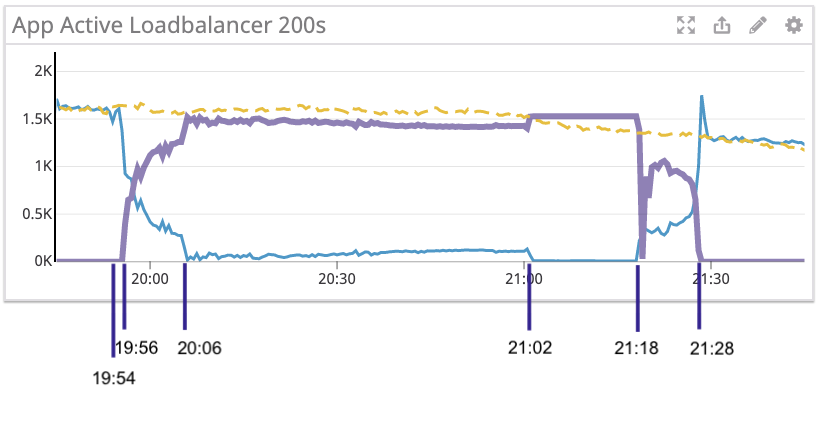
July 29, 2019
Timeline:
- 19:54-19:55: latency event in separate system causes duplicate overlapping requests
- 19:55-20:05: application bug/positive feedback loop starts; this causes queuing and queue overflows in an application server
- 20:06: first database failover; this does not complete normally, and recovery requires disconnecting all clients; this is a new operation and takes time to complete
- 21:02: second database failover with all servers turned off
- 21:18: recovery starts as we turn on servers gradually
- 21:28: web application recovery completes, API completes over the next 20-30 minutes
We focused on the triggering events, which included an application bug and a positive feedback loop. When we reached connection saturation we triggered the bug, which caused write requests to timeout; this maintained connection saturation and increased the rate of write requests because the writes were limited based on the last value, which wasn’t being updated. It was clear that after the database failover, contention was high — but it was unclear if this was cause or effect from something about the failover. Because the database was overloaded in this and subsequent events, we were missing monitoring data and incorrectly concluded that the poor performance after failover was because of the failover procedure.
We were in the process of rolling out a fix for the application bug and continuing investigations into the database performance after failover when the next event occurred.
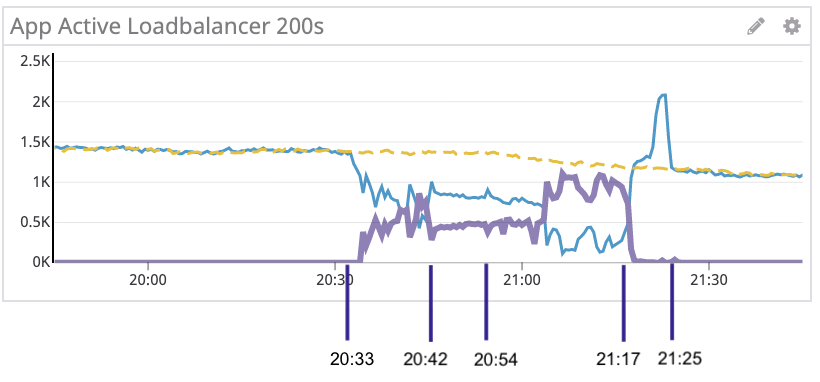
August 1, 2019
- 20:33: AWS EBS volume problem causes high read/write database latency (lasting ~1 minute)
- 20:42: some traffic drained and configuration updated; some requests are successful
- 20:54: database failed over but poor performance persists
- 21:17: internal endpoint throttled, recovery begins
- 21:25: the application recovers fully
This event started with a hardware problem. This caused latency and greatly increased concurrency, which made latency worse, leading to timeouts and queue overflows. The database failover was successful, but the new database was also overloaded. We were ultimately able to reduce load by blocking an internal endpoint; once the database recovered from the overload state, we restored traffic to normal.
This event made clear that the previous story (extended database downtime was caused by unusually bad state from the failover) was incorrect/incomplete. We’ve since concluded that the contention we saw was the result of excess load, rather than the cause. Some of the steps taken to address problems identified in the first event worked, but they caused side effects which made the initial spike of traffic to the database steeper (we have since undone these changes).
We reduced overall write load during this event, and had code-complete (but not yet deployed) changes as of the start of the next event to:
- Avoid a positive feedback loop by using redis as an ephemeral cache/distributed lock (using check-and-set semantics): if we have attempted an update in the past N seconds, don’t attempt again (so even if we’re slow or a write fails, the write rate attempt rate will be constant)
- Back-off on prevent persistent database overload (wait, then return errors to trigger retries with client-side delay if an upstream resources are overloaded; with a latency-sensitive system, failing to reduce load when upstream servers have high latency will create a positive feedback loop, preventing automatic recovery).
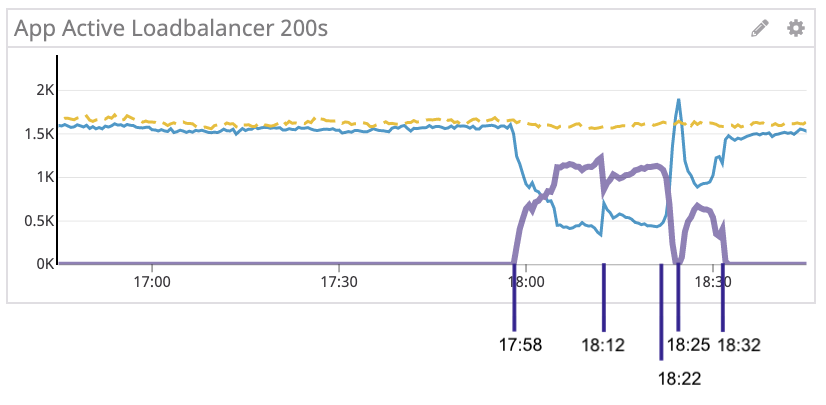
August 13, 2019
- 17:58: AWS EBS volume issue causes high latency (lasting ~30s)
- 18:12: first database failover completes, but the database is overloaded
- 18:22: second database failover completes, with internal load shedding
- 18:25: internal load shedding removed, recovery is in progress
- 18:32: the application recovers fully
This was again triggered by a hardware fault. Time to recovery was improved, but still not nearly fast enough. This kind of hardware failure is expected, though twice for the same instance in a short period is less so. Regardless, our downtime shouldn’t have been as long as it was. We’re now confident that better admissions control will help avoid persistent overload events like this, and have implemented it both at the storage layer (innodb_thread_concurrency) and at the application level (using latency and active connection count to determine health). We’ve reproduced similar events in load testing and confirmed these fixes allowed recovery; we’ve also seen recovery from short events with minimal disruption.
Next steps
Beyond addressing this specific problem, we’re also working on some short- and long-term projects to improve our monitoring and tooling, as this should allow for faster resolution. Architecturally, we’re working on reducing our application dependencies on shared databases as part of the work that we’ve been doing to move from a monolithic server towards services.
While no single change is going to solve every problem, we are committed to ongoing improvements to make Asana consistently available for all customers.