New: Visualize and report on project data with Dashboards
Read this article in French, German, Portuguese, Spanish, or Japanese.
We know from research that the average knowledge worker spends 60% of their day on “work about work” like searching for information, communicating project updates, and chasing down deliverables. It’s grinding, arduous work that’s been made even harder by the challenges of remote working, but it’s also a must-do for team leads who need to stay on top of project progress and status updates. Or is it?
What if there was a better way to visualize and report on project data without having to manually collect and cobble it all together? What if your weekly status reports could all but write themselves? Well, now there is and they can.
Today, we’re excited to introduce Dashboards, a new project-level reporting tool for Asana Premium, Business, and Enterprise customers to help you visualize and communicate your team’s work in more meaningful ways.
Try Dashboards for free today.
Real-time project insights, instantly
With Dashboards, you don’t have to guess where work stands or if a project needs attention. When you navigate to the project’s Dashboard tab, multiple customizable charts will auto-populate with real-time project insights like how many tasks have been completed and who on the team is overloaded. There’s no coding or search queries required, and all of your insights automatically populate in seconds. Best of all, you can customize the charts to slice and dice the data however you need.
Five powerful charts, countless configurations
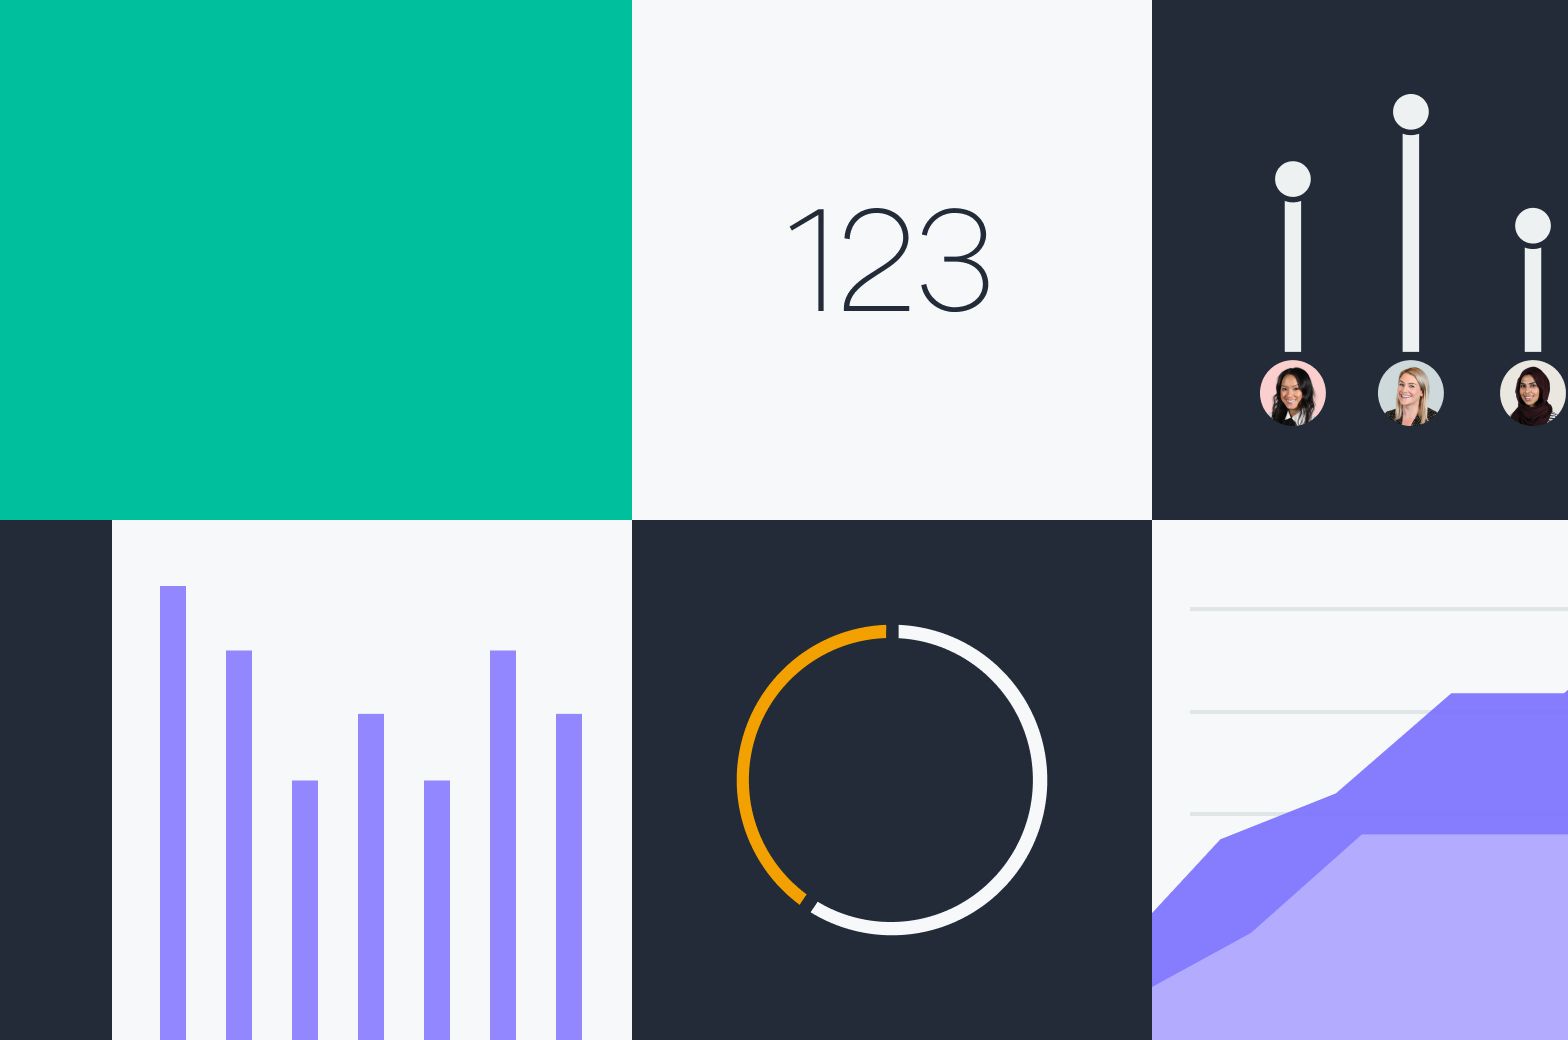
Dashboards provide five powerful charts for visualizing and communicating project data in just the right way.
- Bar chart: View tasks by section or custom field to understand where in your team’s process there are efficiencies and potential bottlenecks.
- Donut chart: Get a quick pulse on complete, incomplete, and overdue tasks, as well as Milestones and Approvals.
- Lollipop chart: View how work is distributed across your team.
- Burnup chart: Track how quickly your team is completing work over time.
- Numeric roll ups: Sum up any numeric custom fields, such as budgets, costs, or estimated hours.
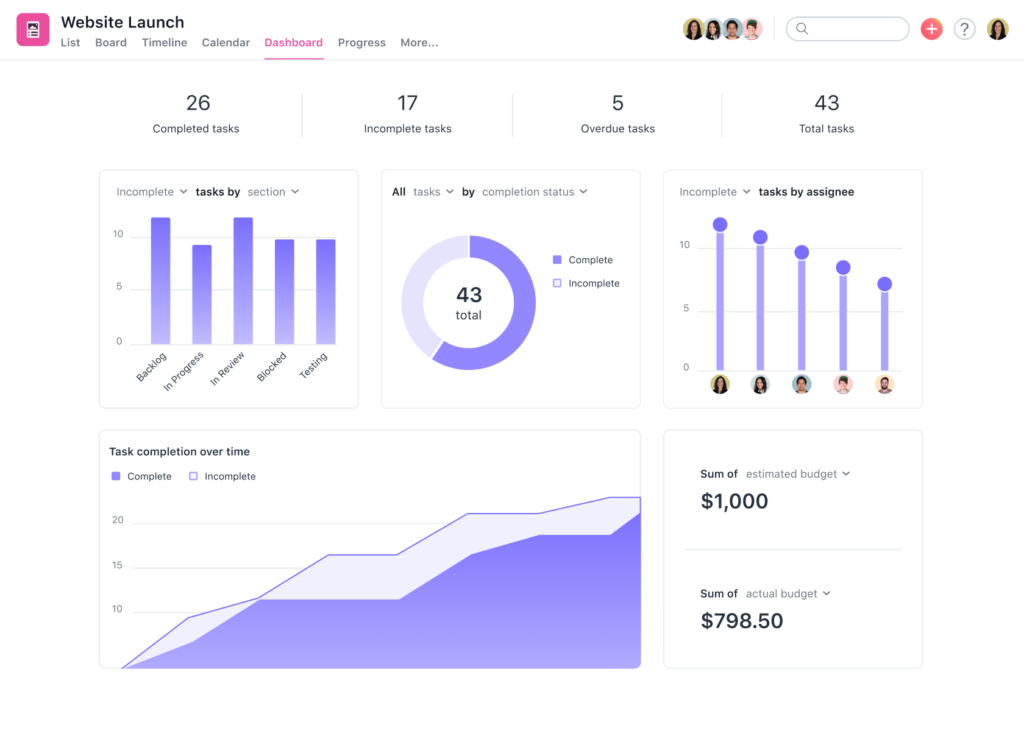
If you notice something is off track and needs to be flagged, you can click on each chart type to take a closer look at underlying tasks, or download the chart as an image for your next stakeholder email or Status update. Status users can also leverage Highlights to call out specific tasks, Milestones, and Approvals that need attention so you can keep work moving in the right direction.
“Status updates are a great feature to keep our team updated and share the latest project highlights with stakeholders. Before using this feature, it was a time consuming process for our team to create project updates that included completed tasks within the past week.”
Drew Chin, Manager, Leadership Development, Charter Communications
Uplevel your reporting today
Whether you want to check in on project progress at a glance or communicate the results of a major initiative, Dashboards and charts make it easy to understand exactly where work stands without calling another meeting or chasing down team members for updates. Try Dashboards for free today and visualize your work in uniquely beautiful, more powerful ways.