7 charts Asana customers love to use for real-time insights

Read this article in French, German, Portuguese, Spanish, Traditional Chinese, Russian, Dutch, Korean, Swedish, Italian, Polish, or Japanese.
Do you ever feel like you’re missing information about your team’s work? You know tasks are being completed and that work is getting done—but don’t know if your team is operating in an efficient and sustainable way.
With Universal Reporting, you get real-time insight into the state of your team’s work and know what actions to take, like requesting more budget, adding headcount, or redistributing work. By creating dashboards of all types, you can pull in data from any project and team, see real-time information, and spot issues before they become bigger problems.
What does Universal Reporting look like in action? Let’s dive into seven charts that Asana customers love to use for tracking work from every angle.
1. Know where work stands, any time

Never get caught off guard by a surprise task. These charts help you understand what’s upcoming and overdue. Quickly get a status check of what’s happening in each area of your team so you’re always two steps ahead of unexpected work.
2. Prevent burnout—before it starts

How many hours of work does your team have to do this week? In 2020, the Anatomy of Work Index found that 87% of knowledge workers reported working late, and 7 in 10 experienced burnout. Make sure your team members don’t get overloaded by understanding how much work is coming up and how it’s distributed across your team. Redirect work as needed or use this information to advocate for extra headcount or contractors.
3. Understand where requests come from and anticipate future needs

Are incoming requests beginning to feel lopsided? Understand the types of incoming work your team is receiving so you know where to shift resources and priorities. Whether you’re running a weekly status report or occasionally checking in, you can keep tabs across projects and better anticipate needs.
4. See workflow stages and anticipate bottlenecks

Get a bird’s-eye view of what stages your team’s projects are in. Do you have a ton of work waiting to be kicked off? Being able to view work by stage makes it easier to address bottlenecks or last-minute rushes before they happen. Now you can spot warning signs and shift due dates proactively before your team gets hit with a flood of tasks.
5. Stay in budget—and know when to ask for more

It’s happened to many teams—getting to the end of a project before you realized you were over budget. Or maybe you wish you’d known you had funds that could be reallocated from one project to another. By creating a chart for monitoring budgets, you can quickly understand the estimated scope of a project and how you’re tracking against it. Keep tabs on how much money is being spent across all of your projects to make sure spending stays on track.
6. Focus your team on high impact work

Have you ever gotten to the end of a quarter, looked back on all the work your team did, and realized that you focused on low-priority work? By looking at task priority level, you can ensure your team is spending time on high-impact work and not getting swamped with low priority tasks.
7. Get your team to inbox zero
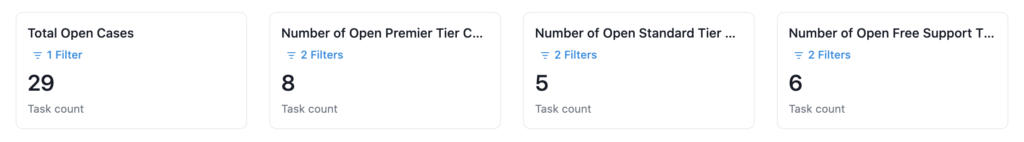
If you’re on a team that tracks work in tickets, like customer success or IT, you want these numbers to be low. Quickly see if there are a lot of open tickets and in what regions or departments. Then, work with your team to prioritize requests so you can get to inbox zero.
All your insights in one place
Ready to dive into your team’s data? Get actionable insights to keep work on track. Start using Universal Reporting today.